In international trading or investment offices, the principal tool of technical analysis is the candlestick pattern. They are looked at as the fundamentals for the entire process of the analysis. Usually it indicates different insights and the price movements of the share market. It is very essential for the traders to have deep understanding and the exact knowledge of these patterns.
Definition of Candlesticks?
It is candle like structures to represent the price movements for some specific time slots. Every candlestick provides information related to the stock prices:
- Open Price: The price at which the asset began trading during that period.
- Close Price: The price at which the asset finished trading during that period.
- High Price: The highest price the asset reached during that period.
- Low Price: The lowest price the asset reached during that period.
Candlesticks are seen in different colors like green, white, red or black to indicate the price movements for a specific time period.
Color indicators are as follows:
- A green (or white) color candlestick indicates: the closing price was higher than the opening price (this color indicator is called a bullish movement)
- A red (or black) candlestick indicates: the closing price was lower than the opening price (this color indicator is called a bearish movement).
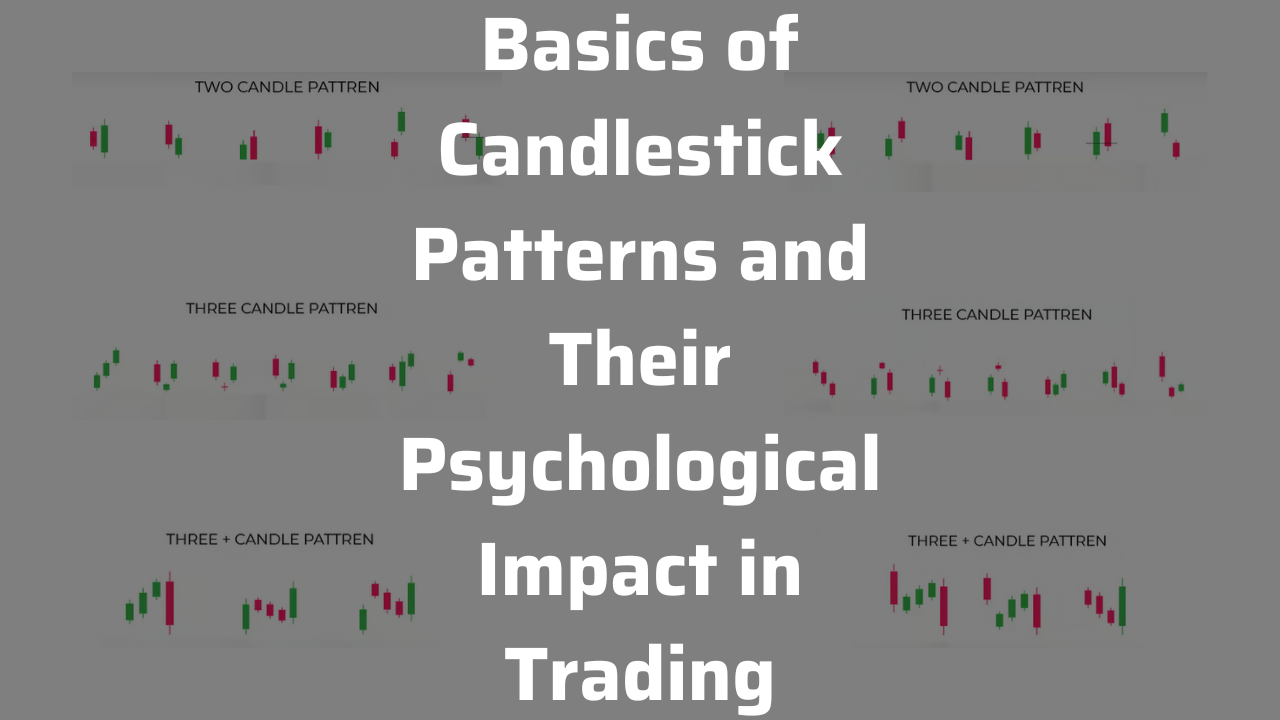
Candlestick Pattern Images

[Image: all kinds of candlestick pattern images Images; source: SGXNifty]
Lets learn some Powerful Candlestick Patterns for beginners
Bullish Engulfing
Bullish Harami
Tweezer Bottom
Morning Star
Bullish Abandoned Baby
Bullish Kicker
Piercing Line
Hammer
Inverted Hammer
Bearish Engulfing
Bearish Harami
Tweezer Top
Evening Star
Bearish Abandoned Baby
Hanging Man
Dark Cloud Cover
Shooting Star
Three Black Crows
Falling Three
Tasuki Gap
Mat Hold
Three White Soldiers
Marubozu
Doji
Gravestone Doji
Dragonfly Doji
Long Legged Doji
Three Outside Down
Three Inside Down
Three Inside Up
Three Outside Up
Psychology and Candlestick Patterns
It’s essential to comprehend the psychology of candles, in order to decipher their signals accurately. Here is how these patterns exhibit the psychological aspects of traders:
- Fear and Greed: The psychology of candlesticks focuses on the greed and fear within and outside the market. For example, when a long bullish candle is able to form it exhibits greed in which the buyers are willing to pay higher and higher prices. On the other hand, when market is represented with long bearish candle it could represent fear in which sellers handle their positions in a hurry.
- Market Sentiment: Patterns such as Doji and Engulfing patterns may indicate reversal of market sentiments. A Doji may mean that the participants of the market are indecisive whereas Engulfing pattern may mean that over-enthusiasm is developing in the market either Bullish or Bearish.
- Confirmation and Reversals: Though there are few exceptions in the Effect of the Disturbance and changes, in most cases traders tend to wait until their trend has been asserted to the upside or that a reversal is impending. The emergence of patterns such as Hammer or Shooting stars gives a trader greater confidence that this is the right time to look for trading opportunities since soon the driving forces of the current market trend are going to change.
- Self-Fulfilling Prophecies: Another example related to candlestick patterns is the fact that they can be self-validating or ‘self-fulfilling’ prophecies. If, among the participants of the marketplace, there exists a critical mass who will create said pattern and believe that said pattern will work for solving some specific problem, said pattern will be enacted and thus further justified and validated its own existence.
Conclusion:
Candlestick patterns are especially useful for the traders since they give a pictorial depiction of the particular market with a given sentiment, including price movements. But equally commendable would be the consideration of inner expectation from the patterns. If such emotions, such as fear and greed or uncertainty when they are driving the market, can be identified the future price action can be more accurately predicted and the trading decisions made…. It does not matter whether you are a beginner or an advanced trader, the accomplishment of this goal will take you closer to candlestick trading – understanding of candlestick patterns and the underlying market sentiments.